Tuesday, November 21, 2017

Are school systems ready to develop students’ social skills?

by Andreas Schleicher
Director, Directorate for Education and Skills


Successes and failures in the classroom will increasingly shape the fortunes of countries.  And yet, more of the same education will only produce more of the same strengths and weaknesses. Today’s students are growing up into a world hyperconnected by digitalisation; tomorrow, they’ll be working in a labour market that is already being hollowed-out by automation. For those with the right knowledge and skills, these changes are liberating and exciting. But for those who are insufficiently prepared, they can mean a future of vulnerable and insecure work, and a life lived on the margins.

In today’s schools, students typically learn individually, and at the end of the school year, we certify their individual achievements. But the more interdependent the world becomes, the more it needs great collaborators and orchestrators. Innovation is now rarely the product of individuals working in isolation; instead, it is an outcome of how we mobilise, share and integrate knowledge. These days, schools also need to become better at preparing students to live and work in a world in which most people will need to collaborate with people from different cultures, and appreciate a range of ideas and perspectives; a world in which people need to trust and collaborate with others despite those differences, often bridging space and time through technology; and a world in which individual lives will be affected by issues that transcend national boundaries.

PISA has a long history of assessing students’ problem-solving skills. A first assessment of cross-curricular problem-solving skills was undertaken in 2003; in 2012, PISA assessed creative problem-solving skills. The evolution of digital assessment technologies has now allowed PISA to carry out the world’s first international assessment of collaborative problem-solving skills, defined as the capacity of students to solve problems by pooling their knowledge, skills and efforts with others.

As one would expect, students who have stronger science, reading or mathematics skills also tend to be better at collaborative problem solving, because managing and interpreting information and complex reasoning are always required to solve problems. The same holds across countries: top-performing countries in PISA, like Japan, Korea and Singapore in Asia, Estonia and Finland in Europe, and Canada in North America, also come out on top in the PISA assessment of collaborative problem solving.

But individual cognitive skills explain less than two-thirds of the variation in student performance on the PISA collaborative problem-solving scale, and a roughly similar share of the performance differences among countries on this measure is explained by the relative standing of countries on the 2012 PISA assessment of individual, creative problem-solving skills. There are countries where students do much better in collaborative problem solving than what one would predict from their performance in the PISA science, reading and mathematics assessments. For example, Japanese students do very well in those subjects, but they do even better in collaborative problem solving. By contrast, students in the four Chinese provinces that took part in PISA did well in mathematics and science, but came out just average in collaborative problem solving. In a nutshell, while the absence of science, mathematics and reading skills does not imply the presence of social and emotional skills, social skills are not an automatic by-product of the development of academic skills either.

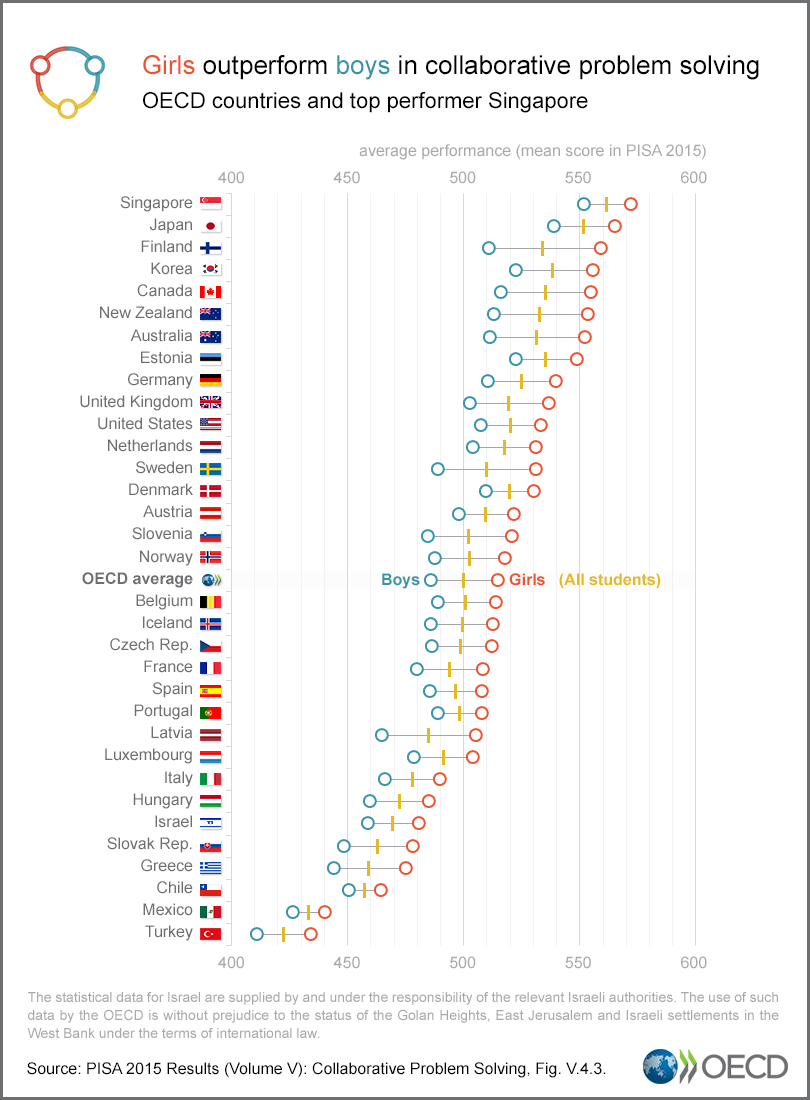
All countries need to make headway in reducing gender disparities. When PISA assessed individual problem-solving skills in 2012, boys scored higher in most countries. By contrast, in the 2015 assessment of collaborative problem solving, girls outperformed boys in every country, both before and after considering their performance in science, reading and mathematics. The relative size of the gender gap in collaborative problem-solving performance is even larger than it is in reading.

These results are mirrored in students’ attitudes towards collaboration. Girls reported more positive attitudes towards relationships, meaning that they tend to be more interested in others’ opinions and want others to succeed. Boys, on the other hand, are more likely to see the instrumental benefits of teamwork and how collaboration can help them work more effectively and efficiently. As positive attitudes towards collaboration are linked with the collaboration-related component of performance in the PISA assessment, this opens up an avenue for intervention for schools.

There also seem to be factors in the classroom environment that relate to those attitudes. PISA asked students how often they engage in communication-intensive activities, such as explaining their ideas in science class; spending time in the laboratory doing practical experiments; arguing about science questions; and taking part in class debates about investigations. The results show a clear relationship between these activities and positive attitudes towards collaboration. On average, the valuing of relationships and teamwork is more prevalent among students who reported that they participate in these activities more often. For example, even after considering gender, and students’ and schools’ socio-economic profile, in 46 of the 56 education systems that participated in the assessment, students who reported that they explain their ideas in most or all science lessons were more likely to agree that they are “a good listener”; and in 37 of these 56 systems these students also agreed that they “enjoy considering different perspectives”. So there is much that teachers can do to facilitate a climate that is conducive to collaboration.

Many schools can also do better in fostering a learning climate where students develop a sense of belonging, and where they are free of fear. Students who reported more positive student-student interactions score higher in collaborative problem solving, even after considering the socio-economic profile of students and schools. Students who don’t feel threatened by other students also score higher in collaborative problem solving. In contrast, students who reported that their teachers say something insulting to them in front of others at least a few times per year score 23 points lower in collaborative problem solving than students who reported that this didn’t happen to them during the previous year.

It is interesting that disadvantaged students see the value of teamwork often more clearly than their advantaged peers. They tend to report more often that teamwork improves their own efficiency, that they prefer working as part of a team to working alone, and that they think teams make better decisions than individuals. Schools that succeed in building on those attitudes by designing collaborative learning environments might be able to engage disadvantaged students in new ways.

The inter-relationships between social background, attitudes towards collaboration and performance in collaborative problem solving are even more interesting. The data show that exposure to diversity in the classroom tends to be associated with better collaboration skills.

Finally, education does not end at the school gate when it comes to helping students develop their social skills. It is striking that only a quarter of the performance variation in collaborative problem-solving skills lies between schools, much less than is the case in the academic disciplines. For a start, parents need to play their part. For example, students score much higher in the collaborative problem-solving assessment when they reported that they had talked to their parents outside of school on the day prior to the PISA test, and also when their parents agreed that they are interested in their child’s school activities or encourage them to be confident.

PISA also asked students what kinds of activities they pursue both before and after school. Some of these activities – using the Internet/chat/social networks; playing video games; meeting friends or talking to friends on the phone; and working in the household or taking care of family members – might have a social, or perhaps antisocial, component to them. The results show that students who play video games score much lower, on average, than students who do not play video games, and that gap remains significant even after considering social and economic factors as well as performance in science, reading and mathematics. At the same time, accessing the Internet, chatting or social networking tends to be associated with better collaborative problem-solving performance, on average across OECD countries, all other things being equal.

In sum, in a world that places a growing premium on social skills, a lot more needs to be done to foster those skills far more systematically across the school curriculum. Strong academic skills will not automatically also lead to strong social skills. Part of the answer might lie in giving students more ownership over the time, place, path, pace and interactions of their learning. Another part of the answer can lie in fostering more positive relationships at school and designing learning environments that benefit students’ collaborative problem-solving skills and their attitudes towards collaboration. Schools can identify those students who are socially isolated, organise social activities to foster constructive relationships and school attachment, provide teacher training on classroom management, and adopt a whole-of-school approach to prevent and address bullying. But part of the answer lies with parents and society at large. It takes collaboration across a community to develop better skills for better lives.

Links
PISA 2015 Results (Volume V), Collaborative Problem Solving
PISA in Focus No. 77: How does PISA measure students’ ability to collaborate?
PISA in Focus No. 78: Collaborative problem solving 
Programme for International Student Assessment's (PISA)

Register for a public webinar on Tuesday, 21 November, 4:00 pm (Paris time) with Andreas Schleicher, Director of the OECD Education and Skills Directorate, and Jeffrey Mo, an analyst in the PISA programme.

Follow the conversation on twitter: #OECDPISA

Join our OECD Teacher Community on Edmodo


Friday, November 17, 2017

How much will the literacy level of working-age people change from now to 2022?

by François Keslair
Statistician, Directorate for Education and Skills 


Taken as a whole, the OECD’s Programme for International Student Assessment (PISA) and Survey of Adult Skills (PIAAC) present a mixed picture for Korea and Singapore. As their economies have grown, these two countries’ education systems have seen fast and impressive improvements; both now rank among PISA’s top performers. However, neither Korea nor Singapore do so well in PIAAC. PIAAC measures the skills of adults aged between 16 and 65, i.e. a large majority of the population, not just the 15-year-olds pupils measured by PISA. And while the skills of younger Koreans and Singaporeans are just as impressive in PIAAC as in PISA, the same cannot be said of their elders, who did not enjoy the advantages of their current successful education systems. The skills of the older population covered by PIAAC simply cannot keep pace with such change.

But why exactly can we draw this conclusion? In other words, why do the drivers of change in the skills of the population examined by PIAAC necessarily work so slowly? And since we are looking into it, why not take the opportunity to try our hand at predicting the future of adult skills, taking literacy as an example? We are all familiar with the strong link between skills and productivity, so predicting the skills of the working-age population could help to identify, for example, trends in some economic fundamentals. This exercise – prospective and necessarily provisional – is covered in the latest issue of Adult Skills in Focus (ASIF), “How might literacy evolve among working-age adults by 2022?”

The first driver of change is population renewal. Without wanting to state the obvious, people aged between 16 and 65 in 2012 will be aged between 26 and 75 in 2022 (unless, unfortunately, they have died). So the population of 16-65 year-olds in 2012 and 2022 will largely overlap, except that 2022’s 16-24 year-olds, who were previously too young, will have joined the population, while 2012’s 56-65 year-olds, now too old (as well as any 16-65 year-olds who passed away between 2012 and 2022) will have left it. This means that only about one-fifth of the 16-65 age group is renewed every ten years.

During that ten-year gap, the remaining population, i.e. four-fifths of 2012’s 16-65 year-olds, will get that much older. People’s skills vary over time. Skills can naturally be learned, but they can also be lost, most often because they are not practised. The second driver of change, then, is the impact of ageing on skills. This subject was covered in another issue of ASIF, “What does age have to do with skills proficiency?”, which identified two trends: first, a marked improvement in the skills of 16-35 year-olds, corresponding to the age of higher education, followed by a slow decline; and second, a distinct improvement for a minority of the population and a small deterioration for the majority, the combined effect of which will not be particularly significant.

In ten years, neither population renewal nor the impact of ageing on skills will be able to significantly affect the skills of all those aged between 16 and 65. But the projections we can make by modelling both drivers reveal a not-insignificant increase, as demonstrated in the graph above.

The improvement in literacy skills ought to be generally observable across all nations surveyed. Some countries may stagnate, such as England and Northern Ireland (UK), and Italy; but the good news is that none should see a decline. On the contrary, some countries should see a considerable improvement. And those countries which are expected to see the greatest progress include – surprise! – Singapore and Korea, although both of them will nevertheless continue to lag behind their neighbour Japan; but in Japan’s case, modernisation had already begun in the Meiji era at the end of the 19th century, which included the modernisation of the education system. The fruits of the efforts invested in education are harvested little by little, over a period of many years, meaning that the future beyond 2022 may well see yet more improvement. But we have to lay the foundations now.

Links
Adult Skills in Focus No. 7: How much will the literacy level of the working-age population change from now to 2022?

Thursday, November 16, 2017

Is the growth of international student mobility coming to a halt?

by Dirk Van Damme
Head of the Skills Beyond School Division,  Directorate for Education and Skills


Higher education is one of the most globally integrated systems of the modern world. There still are important barriers to the international recognition of degrees or the transfer of credits, but some of the basic features of higher education enjoy global convergence and collaboration. This is most visible in the research area, where advanced research is now carried out in international networks. But also in the field of teaching and learning, the international dimension has become very important. The so-called European Higher Education Area stands out as an area where degree structures, credit transfer arrangements and quality assurance frameworks have been aligned in order to adjust qualifications with the needs of an integrated labour market.

Yet, higher education is also one of the most unequal and hierarchical systems of the modern world; globalisation has not yet made the world of higher education a ‘flat’ one. There are huge imbalances between the quantitative supply and demand of education. And the imbalance in quality is even more striking: using an imperfect measure of quality such as the one provided by the global university rankings, one can immediately see that the perceived quality and reputation of academic institutions is concentrated in just a few countries, while the demand is exploding in other parts of the world. The academic top league (say, the top 50 institutions in any of the global rankings) is particularly concentrated, and because of the metrics used to determine quality it is very difficult for institutions in other parts of the world to enter that club.

To some extent international student mobility can be seen as a consequence of global academic inequality. Students are moving to other parts of the globe in order to find the best possible education their money can buy. International student mobility is one of the ways through which the geographical gap between supply and demand is being overcome. Investing resources in one’s son or daughter in order to secure them a high-quality credential has become a preferred strategy of affluent middle class families in emerging countries, especially after their purchasing power started to increase. The chart above shows that for many years the total number of international students remained rather stable around 1 million, but that from the 1990s onwards the numbers started to grow significantly. Some countries were quick to tap into this opportunity and developed strategies to market their higher education offer. From 0.8 million in 1975, the number rose to 4.2 million thirty-five years later.

Many people expected the growth to continue and even to accelerate. But that is not what happened, as is also clear from the chart. From 2012 onwards the growth really stopped. Between 2012 and 2015 a mere 100 thousand students were added to the 4.5 million. The recent figures, published in the OECD’s latest Education at a Glance, suggest that it is not just a temporary setback, but a more structural phenomenon.

What could be the reasons for this change? We probably need to look at developments both on the demand and the supply side. Regarding the former, the obvious explanation is the improvement of domestic education in the most important countries of origin. China, and to a lesser extent India, have invested huge resources in developing their higher education system, including a select number of universities that are predestined to achieve world-class status in the next few years. Chinese universities are now aggressively entering the global rankings and continue to improve their ranks every single year. Changing prospects at home have an impact on the investments strategies of affluent middle-class families in these nations.

Still, changes on the demand side alone cannot explain the lack of growth. Indeed, the potential reservoir of interested students in these countries remains immense. We also have to look at the supply side, to developments in the main countries of destination. It is evident that in the main countries active in the field of exporting education services, things have fundamentally changed as well. From a very hospitable and welcoming approach to international students, popular and political attitudes have reversed things into a much more hostile stance. This has happened in the main destination countries such as Australia, the UK and the US, but also in upcoming players such as Switzerland, Sweden or the Netherlands. The general backlash against migration, aggravated by the refugee crisis and the flows of asylum seekers, has also turned the climate for foreign students upside down. Populist and often false accusations that foreign students are only interested in permanent migration, and that they take the future jobs of domestic students, are now in the media every day.

The recent 2017 Open Doors Report on International Educational Exchange data, published by the Institute of International Education (IIE), points to a decrease of 7% in the numbers of new international students enrolling in US higher education institutions. The majority of surveyed institutions (52%) in the IIE survey expressed concern that the country’s social and political climate could deter prospective international students. In the UK, a political decision is being discussed of removing international students from the government’s target of reducing net immigration. Still, Brexit and a general hostile climate against migration in the UK is probably also becoming a deterrent for international students. Similar developments can be seen in other countries of destination.

What is happening at both the demand and supply side of international higher education is fundamentally reshaping the size and direction of international student mobility flows. In a strange way, they are reshaping the global academic inequalities. At the same time they are also redefining where and how the future professionals and leaders of the 21st century world will be educated. Just as much as academic education was an important instrument in shaping the post-WWII global order, the current changes in international education will have a profound impact on the 21st century world.

Links 
Education at a Glance 2017: OECD Indicators
Open Doors 2017

Follow the conversation on Twitter: #OECDEAG 


Wednesday, November 15, 2017

Is free higher education fair?

by Andreas Schleicher 
Director, Directorate for Education and Skills 


Skills have become the currency of 21st century economies and, despite the significant increase the UK has seen in university graduation over the last decade, the earnings of workers with a Master’s degree remain over 80% higher than those of workers with just five good GCSEs or an equivalent vocational qualification. Sure, not every university graduate will end up with a great salary, but the claim that for many studying does not pay is a myth: just one in 10 university graduates earn less than half the median salary, a figure which is double for adults with only five good GCSEs, and another 22% of graduates earn between half the median and the median salary. Conversely, 21% earn more than twice the median, three times more than those with five good GCESs. Beyond the monetary benefits, higher education brings important social benefits for individuals and nations, ranging from better health through to greater social participation, and up to more trust in people and institutions.

Some say these trends are all futures of the past, and that the job prospects of future graduates may look much worse, particularly if bringing in more and more people eventually means including less qualified applicants. But people have been saying these things ever since I began tracking those numbers over a decade ago, and the bottom line is that, so far, the rise in knowledge workers has generally not led to a decline in their pay, as we have seen for people at the lower end of the skills spectrum.

That brings up the question of who should pay for this, because there simply is no free university education.

The Nordic countries in Europe pay for universities through the public purse and some even generously subsidise the living costs of university students. It makes sense for them because participation is almost universal and they have a steeply progressive tax system so that they can recuperate the funds from graduates who typically end up as the better earners.

European countries like France or Germany, too, say higher education is important, but their governments are neither willing to put in the required funds nor allowing most of their universities to charge tuition. They end up compromising quality and limiting provision, with the effect that all workers end up paying for the university education of the rich parents’ children. That is, because wherever access is limited, it tends to be the wealthiest and not the smartest students who get the best places, whatever the source of funds.

The third alternative is to allow universities to charge tuition, and interestingly, OECD data show absolutely no cross-country relationship between the level of tuition fees countries charge and the participation of disadvantaged youth in tertiary education. In fact, social mobility is worse in Germany, which pays for all almost university education through the public purse, than it is in the UK. That is because to mobilise those public funds for higher education, Germany ends up charging tuition for children in kindergarten, which leads to a much less level playing field from the start.

But getting tuition right is not simple either. If countries put the burden for tuition entirely on the shoulders of families, they risk not attracting the brightest but instead the wealthiest children to attend, which means not making the most out of the country’s talent.

If countries rely mainly on commercial loans which students have to repay once they finish their studies, they still leave students and families with the risk, because the promise of greater lifetime earnings of graduates is a statistical one, and there is actually very wide dispersion in earnings. The UK, and some other countries too, have tried to square that circle with a combination of income-contingent loans and means-tested grants. That basically means risk-free access to financing for prospective students with governments leveraging, but not paying, for the costs.

The loans reduce the liquidity constraints faced by individuals at the time of study, while the income-contingent nature of the loans system addresses the risk and uncertainty faced by individuals (insurance against inability to repay) and improves the progressiveness of the overall system (lower public subsidy for graduates with higher private returns). In the UK, the repayments of graduates correspond to a proportion of their earnings and low earners make low or no repayments, and graduates with low lifetime earnings end up not repaying their loans in full.

But even the best loan system is often not sufficient. There is ample evidence that young people from low income families or from families with poorly educated parents (but also youth who just don't have good information on the benefits of tertiary education) underestimate the net benefits of tertiary education. That’s why it has paid off for the UK to complement the loan scheme with means-tested grants or tuition waivers for vulnerable groups. It will be worth it to continue to do so, simply because people with better education will pay much more in taxes than what their education costs.

Sure, those loan and grant systems cost money, and have shifted risks to government which will end up paying for any bad debt. Indeed, it is very likely that repayment rates will end up a lot lower compared to what the Government anticipated in 2012. But these costs are just a tiny fraction of the added fiscal income due to better educated individuals paying higher taxes, let alone the social benefits. Keep in mind that the added tax income of those graduates who end up in employment, on average over £80 000 in the UK, is many times larger than any conceivable bad debt. And where students don’t pay their loans back, tuition will still have had important effects in terms of having students choose their studies carefully and complete them on time, something where the UK does so much better than most other European countries.

Every year I am reading media stories that the financial burden on students, perceived or real, is choking off entry into higher education. But every year our statistics show a rise in entry to higher education. It’s also noteworthy that the UK ranks second after New Zealand when it comes to the share of international students, which is another indicator of the attractiveness of UK higher education.

Still, there is a lot the UK can do to further improve its approach to financing universities. For a start, it can do better with aligning course offerings with societal demand. That may also mean thinking more carefully about fee structures, ensuring that these better reflect the cost of provision and the value to students. Indeed, it is crucial to ensure that fees reflect the educational value of the programmes for students, rather than the amounts that universities can extract from students simply because graduates can expect higher lifetime earnings that also reflect their prior attainment.

Consider that England currently has an above-average share of low-skilled 20-34 year-old graduates, but an above-average share of tertiary graduates. Any increases in tuition fees must therefore demonstrably go into better teaching and learning. The Framework of Excellence makes a start to address this, but it does not yet adequately capture the most important element in this regard: the value that universities add to student learning outcomes.

I also worry that the loan repayment parameters mean that many middle income workers – such as teachers, health professionals, public sector workers – will end up paying more for their education than better earners such as lawyers and bankers. Not least, it needs to be kept in mind that many UK students are likely to have some level of debt for up to 30 years and some research on the broader implications of student debt would be important. Contrast this with Australian students who pay off the loan for their undergraduate degree within nine years of graduation.

That being said, among all available approaches, a system of income-contingent loans and means-tested grants is still the most scalable and sustainable approach to university finance. From a public policy point of view, governments should invest public resources in education over the lifetime of a young person in those stages where its impact is greatest, both in terms of efficiency and equity. Higher education is not high on that list.

Links 
Education at a Glance 2017: How much do tertiary students pay and what public support do they receive?
Enhancing higher education system performance: Benchmarking higher education system performance

Follow the conversation on Twitter: #OECDEAG

Image source: @Shutterstock

Thursday, November 9, 2017

What matters for managing classrooms?

by Francesca Gottschalk
Consultant, Directorate for Education and Skills 


Teaching is a demanding profession. Teachers are responsible for developing the skills and knowledge of their students, helping them overcome social and emotional hurdles and maintaining equitable, cohesive and productive classroom environments. On top of their teaching responsibilities, they are also expected to engage in continued professional development activities throughout their careers. The demands of the job are many and varied, and teachers tend to report some of the highest levels of workplace stress of any profession. This contributes to the loss of many talented and motivated individuals from the teaching workforce.

Teachers, especially the least experienced, tend to report that student disengagement and misbehaviour is one of the biggest stressors. In fact, terms like “reality shock” or “shattered dreams” are sometimes used to describe what happens when teachers are first put in front of a classroom.

So, what can be done? There are a number of ways to soften the sometimes harsh contrast between their expectations and what really goes on in the classroom. Specialised training and practicum during teacher education programmes can help prepare new teachers for the realities of teaching, while protective factors, such as teacher self-efficacy or confidence in their skills, can also make a big difference. When teachers are capable and confident in classroom management, ensuring that lessons are run smoothly in an organised classroom environment, student learning and positive social and emotional outcomes can be enhanced.

How can we establish if teachers have this “protective factor” and are confident in their abilities? The Innovative Teaching for Effective Learning Teacher Knowledge Survey offers a unique opportunity to better understand teachers’ professional competence and how this is developed. The pilot study assessed teachers’ pedagogical knowledge (or, in simple terms, what teachers know about teaching and learning), their opportunities to learn, and other professional competences, such as self-efficacy. Teachers’ knowledge of classroom management is part of their “toolkit” of instructional processes, which also encompasses elements like teaching methods and lesson planning.

The pilot results suggested that in-service and pre-service teachers have a relatively strong knowledge of classroom management, especially in comparison to other areas of pedagogical knowledge. Teachers who reported being confident in their classroom management skills also reported being provided with lots of opportunities to learn how to manage classrooms and tended to be more experienced teachers. As there is a link between teacher confidence and retention, the relationship uncovered between learning opportunities and self-efficacy in this pilot study is quite promising!

Furthermore, since experienced teachers tended to show higher self-efficacy than their pre-service counterparts, it could be helpful to build more field experience into teacher education. Many countries across the OECD, such as Estonia, Hungary and Israel, are already doing this. Similarly, longer induction sessions before entering the teaching workforce could also help bridge the gap between expectations and reality – this approach will be important to explore further, especially as teachers find classroom disturbances to be one of the most stress-inducing parts of their jobs. If left unchecked, it can eventually lead to burnout.

The pilot project was an initial exploration of teacher knowledge and competence that has laid the groundwork for future work on a larger scale. Its purpose was to provide evidence that can help shape policies to improve teacher preparation and education, but it can also help to attract (and retain) high-quality individuals to the profession.

Strong education systems depend on having an effective teaching workforce. It is therefore essential to equip them with the knowledge and skills for them to be effective and confident in the classroom. In order to keep them there, countries need to focus on piecing together the “shattered dreams” of teachers, and supporting them as much as possible along the way.

Links
Teaching in Focus No. 19 - How do teachers become knowledgeable and confident in classroom management? Insights from a pilot study
Innovative Teaching for Effective Learning Teacher Knowledge Survey
Understanding teachers' pedagogical knowledge: Report on an international pilot study

Photo credit: @Shutterstock